Showing posts with label Population. Show all posts

Saturday, April 6, 2024

Value Statement

“Exploring new ways of thinking, for fun and optimization of the amount, longevity, and quality of life.” – Bradley Jarvis profile, X (formerly Twitter) @bradjarvis

That introduction is a succinct statement of my values and how I most prefer to serve them. The term “life” is more general than I’ve typically used it elsewhere, applying to both humanity and other species. 

By my calculations, collapse of both populations is avoided where natural habitat that includes other species accounts for more than 63% of the sum of habitat and what people are consuming to survive. Put another way: The habitat that supports humans requires about the same amount of additional habitat to support it; less than that and it decreases, unable to support as many of us. If we were like other species and did not generate waste, our population would decrease to a level that could be supported by the remaining habitat which is supported by what it needs that grows back; but with increasing waste, that can’t happen, and we all die together.

What I just described accounts for the amount of life. How long both populations can survive is the longevity. Quality of life is how well members are matched to their environments, receiving benefits commensurate with what they contribute to the health of others. Humanity’s creation of waste, whose function as the essence of artificial environments is to provide benefits without requiring the giving of benefits, has enabled increasing quality of life for some at the expense of life itself for others – nonhuman and human.

One of my “new ways of thinking” is to tie amount, longevity, and quality as aspects of life to the values of people, habitat, and waste that I’ve identified in my other writing and described briefly above. How the aspects of life are to be optimized depends on the relative priorities of the values; and those priorities will be different for different people. For that reason, my recent research has been focused on deriving what those priorities might be (and how they might change) within given populations of people; and presenting the results as aspects of life within simulated “worlds” with similar pasts and different futures – one of which might be our own.

My greatest interest has been how to increase human longevity since our extinction would be the end of all our lives and our values along with them. The dependency of longevity on the amount of available habitat over time and the number of people consuming it to meet basic needs is a good reason to give habitat at least as high a priority as people. Waste would be the lowest priority, though it can serve longevity if a fixed amount of it is used as protection from threats to it that can’t be dealt with otherwise. Waste also can be, and has been, used to access more habitat if habitat is diminishing or population is growing beyond what existing habitat can support.

 From the perspective of other species, my guess based on extensive reading about biology and specifically ecology is that, for many, the value of population size (as procreation) would be the highest priority. Habitat (food supply and shelter) would be second. Waste wouldn’t even occur to them unless it was mistaken to be part of their habitat. Generally speaking, enabling development and maintenance of healthy, diverse ecosystems is the best way to optimize non-human life. This would, as a minimum, involve getting rid of waste and making the rest as harmless as possible.

As for the fun part of creative thinking, it’s a natural reward that draws me to do more of it no matter what circumstances I’m in.


Saturday, August 26, 2023

Groups of Value

The term “values” can be reduced to what someone uses to define “good” and “bad.” In my attempts to quantify it and relate it to behavior and global outcomes, I’ve identified a set of resources and amounts of them that everyone has and uses to some extent. Fractions of the totals of each per person throughout a population, representing how much each resource is valued, are ranked based on calculated distributions of each using historical projections of the totals over time that are embodied in simulations.

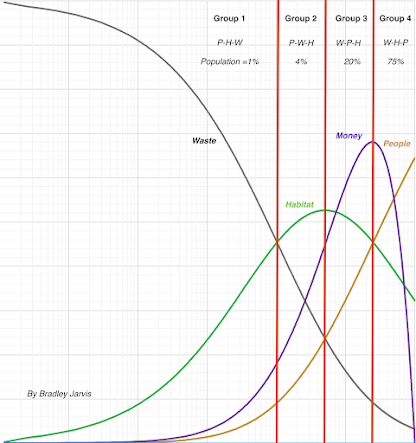
There are four identifiable groups that remain constant in their fractions of the population until too little habitat remains to support each person and members of the species that maintain it. The ranks of value placed on waste (artificial environments), habitat (natural environments), and people are unique to each group, as shown below. Note that the two middle groups could also be considered one group, as mentioned in Distributions.

Waste is valued most by the smallest group and people are valued most by the largest group. Habitat is valued most by the two middle groups, with one valuing waste second and the other valuing people second. No one in one group places the same amount of value on people or waste as anyone in another group. Members of either of the middle two groups can value habitat the same as members of the other group, but not members of either of the two remaining groups. Some members of the smallest and largest groups can value habitat the same, but no one can value habitat the same as members of the two middle groups.

If the value placed on each of the resources is exclusive of the others across the whole population, the fraction of the population valuing waste is 9%, the fraction valuing habitat is 40%, and fraction valuing people is 51%. Note that even for these groups, the fraction valuing people is much larger than the fraction valuing waste.

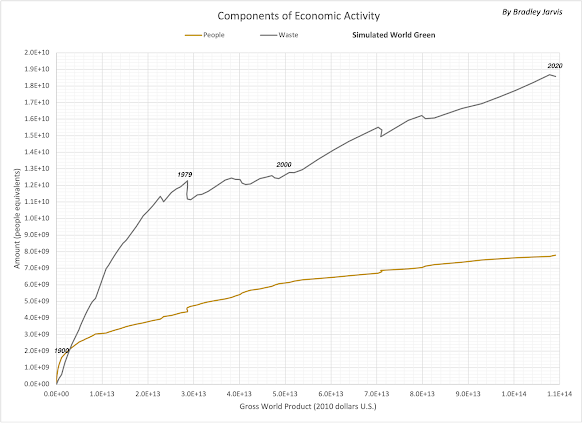
Money as a resource indicating relative economic activity (as indicated in the diagram for small populations and discussed in Economic Distribution) have favored equal value placed on people and habitat (corresponding to half the total habitat available to the population) while promoting increased waste by those who value it most. As shown in the following graph, waste production by a simulated world like ours has outstripped population growth (driving human transactions) as a component of economic activity and remains strongly associated with it. The “rich,” those benefiting most from that activity, and everyone else, represent another set of groups - defined by the value placed on money.

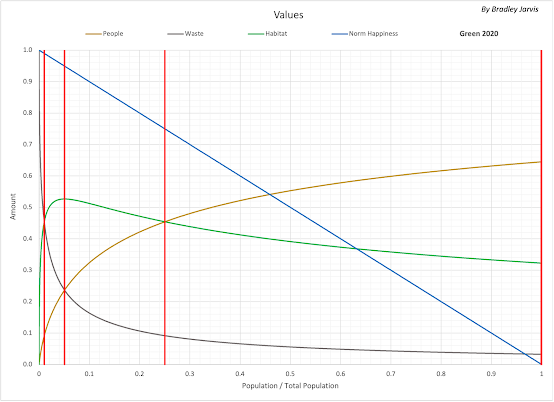
Implicit in this approach to quantifying what someone considers good and bad is the debatable assumption that their current conditions represent what they prefer, and that others they compare themselves to are likewise in preferred conditions. Even using change over time might not be a reliable indicator of preferences; the change could be so far beyond the person’s control and the destination is opposite to their preference. Referenced to groups, a person could move from one group to another due to the actions of others or environmental effects that force change in availability and consumption of resources. This appears to necessitate an additional variable for consideration: choice. Based on national statistics from 1800-2017, happiness varies as shown below, as does life expectancy, where the red lines mark the limits of each the four groups we started with; this suggests that members of a population will tend to prefer a higher value of waste.


As waste effectively decreases habitat, the ability of nature to provide basic biological needs decreases to a point where more people die than are born, beyond which the population crashes. Thus, increased waste decreases how long the population can exist (its longevity). Another set of groups could therefore consist of a group that cares about longevity being longer and the other that doesn’t. The group that cares about longevity would likely value habitat more than anything and waste less than people; the other group would consist of everyone else.


Saturday, July 15, 2023

Distributions

People are organized into communities that enable the acquisition, movement, manipulation, and use of resources in order to maximize the quantity and quality of what they value. Each community has its own strategy for doing so based on its values, its abilities and the composition of its environment.


Averaged over the world population for more than 70 years, my simulations show that the annual distributions among people of biologically useful resources have maintained a common pattern, with communities changing what parts of the pattern they occupy and the parts they interact with. The primary distributions are people, habitat (resources composed of, and used by, other species), and waste (resources converted by humans into forms that are not biologically useful). 

Processed to display how their amounts change relative each other, the distributions can be used to indicate how much different parts of the world’s population value people, natural environments (habitat), and created environments (waste). As the number of people is added up in order of increasing habitat density (people per unit of habitat), the value of people rises; the value of created environments drops; and the value of natural environments climbs to a peak and then falls. This is shown below.


There are three distinct groups defined by the intersections of the trends. The smallest, amounting to 1% of the population, is dominated by the value of waste over habitat and people. The second, amounting to 24%, is dominated by the value of habitat over the rest. The third and largest group, 75% of the population, is dominated by the value of people. Based upon my simulations, any isolated population with limited resources (embodied by habitat), that is not consuming more than a critical amount of them, will have these characteristics. 

Consuming more than two-thirds (67%) of total resources results in the first group growing at the expense of the other two until the amount of remaining resources is less than the total number of people - who will be in just one group that values everything equally. My simulation that best matches history shows that this year humanity will be consuming more than the critical amount, as shown below, and will reach the end point bordering on extinction by 2040.


Saturday, October 8, 2022

Upgrades


For much of this year I nursed a slowing computer while attempting to further my research and to do some writing within time limited by working a full-time job (luckily at home). As has happened in similar experiences, I built up a cache of insights that I could share when conditions permitted while sharing tidbits of related wisdom and information on social media platforms, most notably Twitter (@bradjarvis), which also served as a tool for collecting relevant source information. Just when my computer became unusable due to “upgrades” in the operating system and software that its speed could not handle, I capitulated to the need for a hardware upgrade (a new computer) to keep up with them and maintain the most basic functionality.

My new insights, as the most useful have, came from taking a fresh look at the essence of the mathematical modeling of historical data that has dominated my decades-long research into how basic values and resource availability are coupled to affect how long and how large a population can survive. This phase of the research focused more on what happens to groups within a global population than on projections of what happens to the entire population, requiring many more calculations to provide meaningful results. I had enough results by the time my computer became unusable to begin drawing conclusions that could be tested and used to extract a simple set of rules that embody their derivation.

The most fundamental insight of the model has been that human consumption of ecological resources (provided for sustenance of life in ecosystems) varies predictably with habitat density; where habitat density is the ratio of consumption for needs to the number of resources that remain (which are available to members of other species to meet their needs). One of my new insights is how consumption for needs (which is proportional to the number of people) increases with habitat density, and how the amount not consumed for needs (what I call waste) decreases with habitat density. 

Economic activity, measured globally as Gross World Product (GWP) and on a national level as Gross Domestic Product (GDP), is a function of the number of potential exchanges of resources, which varies with the number of people and the resources they consume. The distribution of people and resources derived from their relationships to habitat density can therefore be used to estimate the range of habitat densities occupied by an economically active group like a nation for which that activity is measured. Related aspects of people’s lives such as life expectancy and happiness show looser correlations with habitat density that can therefore be used on a society level to infer the dominant values associated with those aspects along with the more direct ones: population size and longevity (how long the society can survive with its resource base).

The upgrades to the underlying historical data and its analysis showed that, in general, nations have kept their minimum habitat density the same as the world’s while varying their maximum habitat density. This maintains a link to the people in the society with the most access to resources that can be used to meet needs and are paid handsomely for it. In the extremely rare exceptions where that link has been severed, it appears to have been accompanied by rapid demographic transition or government collapse. If, as most of my simulations of the world’s future show, the minimum habitat density climbs in response to critically depleted resources, what triggered those exceptions may also become outcomes in a self-sustaining feedback loop that accelerates the process, enhanced by environmental feedbacks that further reduce available resources.

For now, my new computer is performing as well as I hoped, apparently matching what my not-too-old computer was able to do. Like humanity’s instinctive drive to increase the number of people in the world, which seems to be our dominant value, my hard drive is filling up with the inevitable upgrades to my software and the files (and increases in file size) that I am generating with each new increment of my research and writing. Some time when I least expect it, a critical amount will be used and a new set of upgrades will threaten to make this computer inoperable, just as our planet is on the verge of becoming unable to sustain life as we know it, forcing us to quickly (and impossibly) find and move to another one or die. Refusing that next upgrade is still an option, as is reducing what we’re already doing with it so we can use fewer resources. Unfortunately, our planet – like my last computer – may be doing the ecological equivalent of changing the operating system so that functions we need can no longer be done without a lot of adaptation. Time is running out to find and implement a solution to this conundrum, and I’ll keep doing what I can to help that process.


Thursday, March 11, 2021

Values and Responsibilities


Next month will mark three years since I quit my job to work full time on completing decades of research into how actions serve values and translate into global consequences. Beginning with the primary value of survival (because without survival there can be no other values) I had focused on how many people can exist, for how long, and under what conditions. The scope broadened to include life satisfaction, or happiness, which correlates strongly with the number of resources people consume that are provided by other species. Statistical analysis of historical data for population, life expectancy, economic activity, and other variables revealed other correlations that tracked consistently throughout the data and suggested a theoretical framework that linked them together.

Translation of the resulting mathematical model into experiences of individuals and groups enabled testing by comparison with events and stories from the past and present, along with projections of potential futures. The potential futures were extremely disturbing, since they indicated a high probability of an extinction-level population crash in the near future. Because of this, I worked mostly on deriving alternatives and actions that would enable them, much as I had used models of equipment and conditions to troubleshoot problems that I found during my career as a test engineer. I concluded that effort last year after simulations incorporating global warming variables and the effects of the COVID-19 pandemic converged on a narrow range of actions that might significantly delay catastrophe.

With my savings starting to run out and hardly any income from the writing business I hoped could support my efforts, I spent more time searching for another paying job. This experience has been both a necessity and a test case for how to live based on what I learned. Reading hundreds of job descriptions has reinforced a lesson learned during past job hunts and embedded in my model: money flows toward those taking risks to find, exploit, and trade resources that can be used for future growth. Servicing those people or becoming one of them is increasingly a key to individual survival; it is also a surefire way to help decrease the longevity of civilization by eliminating other species that we depend upon for our collective survival because there are no new ecosystems that can sustain us. The fastest and most direct way to extend our lifetimes is to clean up and leave habitat we have taken from use by other life, which is the opposite of what our economy rewards.

Hunting for income triggered an evaluation of successes and failures in past jobs so I could find better matches in the future. Defining success as the meeting of my expectations and my employer’s expectations with minimal difficulty for both of us, I realized that success for me depends on matching my responsibilities with my values. Ability is another factor, but I’ve been able to learn and adapt quickly enough in most situations to keep it from being a major one. Failure, when I experienced it, was typically associated with a conflict between an employer’s expectations and one or more of my values which couldn’t be remedied to the satisfaction of both of us. 

This insight about employment suggested a new way to characterize the results of my research, which I was coincidentally starting to formalize as a scientific paper that could be reviewed by academics and others for strengths, flaws, and potential use in further research. A person in any of three relationships with their environment (growth, overshoot, loss) focuses on attaining one or more states of being (survival, happiness, longevity) for one or more groups (self, other people, all people and other species). Values and responsibilities can both be categorized by focus, which usually includes self-survival, self-happiness, and self-longevity. 


Relationships to environments tend to predispose the people in them to get what they don’t have enough of, so the relationships can be used as proxies for common sets of values and responsibilities. In general, everyone prefers to be in the overshoot relationship - every person that is, since overshoot involves our consuming more than other species can replenish and therefore depends on them dying off. The inevitable decline in resource availability reduces how long the population can survive (its longevity), which is felt by individuals who are forced into the loss relationship and therefore value reversing what caused it. Meanwhile, people in the growth relationship value survival of themselves and people in their closest groups; this drives population growth along with individual consumption that increases happiness by enabling creation of personalized artificial environments.

Although most of my life has been spent in overshoot, I was strongly influenced by a culture of growth. I also experienced loss and have accepted its all-inclusive values. I’ve been questioning the wisdom of unlimited consumption and its impact on longevity since I was 16 years old; and for various reasons I avoided situations where I might have children until it was practically too late. As an older adult facing loss again while trying to maintain a hold on overshoot, I know from my research that the world as a system is about at the same point and is on the verge of moving every person and other species into the loss relationship either by choice or by force.

The scenarios that I derived for delaying catastrophe are simply summarized by one rule: Avoid loss. Keeping everyone from being in the loss relationship with the environment starts with freeing up habitat for those already there, which my most-likely scenario estimates could be 5/6 of the world’s population by mid-year. Completing that move by the end of this decade could also keep global warming from making parts of the world uninhabitable while we develop ways to reclaim even more habitat and learn to live with the result. Notably the (simulated) last time no one was in the loss relationship was in 2001, and the last time no one was in overshoot was in 1949, which provides some historical context for what we might expect.


As improbable as that scenario is, I suspect another one may be emerging that could be considered just another version of catastrophe by those valuing all life. Humanity’s ability to consume more than what other species can provide without harm (thus “overshoot”) is a consequence of large-scale replacement of natural habitat with artificial environments that contribute to happiness and together can be considered artificial habitat. In the new admittedly speculative scenario, attempts to escape the deathtrap caused by reducing the amount of remaining natural habitat are enlisting molecular engineering and machine intelligence to create a new biology that totally redefines what and who we value, including ourselves and our needs. Time is running out for this scenario to play out: my model projects that, on the current trajectory of consumption, people will start dying from lack of habitat by 2026 and humanity will be extinct by 2057. For the new scenario to match the expected one (and what I consider a reasonable timeline for new technology rollout), this may be a manifestation of how the rest of the population transitions from growth through overshoot over the period 2028-2044 while so many others are dying.

The next two decades will either validate or invalidate the concepts I developed over the past two decades. Since exploration is a process and not an endpoint, I expect that if I’m alive then I will have asked many more questions than I answered while helping to more effectively find other answers; and I will be happy to have done so. To the extent that my efforts, whatever they are, contribute to creating a longer and better past for those whose lives I affect directly and indirectly, my life will have served my values. By that standard, I intend to increase my overall positive impact until I can’t, choosing appropriate responsibilities along the way.


Monday, November 9, 2020

Habitat Loss


As our species dominated and the world’s ecosystems, we made them part of our own habitat. The tools we used to do so were simultaneously used to create artificial environments that removed or spoiled resources that could be used to meet the basic biological needs of species we directly or indirectly depended upon for our survival, threatening to exterminate them and - in much the same way - us. This is a story told by statistical simulation of our history by my Timelines model and ecological observation of how extinctions occur.


According to my simulations, resources available for meeting human needs (what I’ve called “ecological resources”) are now only double the amount consumed for needs. This allows for consumption of only 15% more needs before population reaches a peak and then collapses. Most likely, collapse occurs because the populations of species (counted as resources) that supply the resources we directly consume themselves collapse. Our population peak is projected to occur no later than 2024, after which casualties are unavoidable.


ABOVE: Current summary of global variables and their projected trajectories. 


The COVID-19 virus is already exacting a toll on our population. It can be thought of as a consequence of habitat loss, because the other species in our habitat are likewise experiencing habitat loss, being forced to share more of their space with us and enabling those that prey on them to prey on us. Critically shrinking habitat is making this situation catastrophically worse even as our temporarily restrained consumption slows the rate of the shrinking. 


Meanwhile, climate change is becoming a self-sustained feedback of our pollution that is destroying habitat and creating conditions such as melting ice that will drive it further on its own. Our collectively growing obsession with reducing greenhouse gas emissions (climate-altering pollution) might slow the destruction, but more is necessary because we are too close to the critical point where species including ours might not avoid collapse in time to recover. 


As I’ve suggested before, the best option is to radically increase the total amount of habitat by reducing what we are currently consuming (in needs and waste). This will buy time for us and the other species we save to create barriers to further loss, including cleanup of waste such as that threatens to increase global warming. My simulations of such an approach provide insight into the attendant physical and social consequences that be used to craft a strategy for making them a reality and monitoring the results.


ABOVE: Summary of global variables after a reduction in consumption from 2021 to 2030. Reducing the amount of greenhouse of gases in the atmosphere to avoid more dangerous temperatures would need to occur soon. 

Wednesday, April 15, 2020

A Pandemic-Altered Future


I have continued refining my simulations to account for the progress of the COVID-19 pandemic and the potential futures that might result from it. The strong correlation of carbon emissions and total consumption suggested that atmospheric carbon dioxide concentration could be used to estimate total consumption; I would then project total consumption along with the ratio of needs to remaining resources based on population projections made from pandemic global death statistics and my simulation (Green Prime) of population without the pandemic.

A curve fit of carbon dioxide concentration and total consumption automatically factored in the effects of natural contributors and the cumulative aspect of consumption and extracted the resulting consumption, as shown below.


I updated projections using weekly mean concentration and the average difference between Green Prime population and total deaths from COVID-19. The current projections are shown below.


Despite the apparent convergence of deaths toward a maximum beginning in May, the projected population (“R Projected”) suggested a much different situation. This was perhaps due to an excess of deaths by people who couldn’t be treated for life-threatening conditions other than the virus, or it was due to underlying growth in the virus-related deaths, or both, but it convinced me to continue allowing the possibility of greater growth in deaths as shown in today’s population projections below.


Projecting global variables into the future based on current data shows that the virus would result in one year less of survival for our species, as shown below.


Reducing per-capita consumption (ecological footprint) would still extend our remaining time, although temperature would continue to rise. The following graph shows one such scenario: a 2% annual drop until just needs are being met.

Another option is to freeze consumption at peak happiness and life expectancy as shown below. This would result in temperature exceeded the 2-degree Celsius threshold earlier, which would likely force a decrease in population.


Tuesday, March 31, 2020

Bridging the Future


Shortly after discovering that constant capacity (total ecological resources) provided a better fit to historical data by my Timelines model than my baseline simulation (“Green”) that decreased it, the COVID-19 pandemic threatened to significantly change the world’s population-consumption trajectory on its own. 

The model has two main purposes: to help people judge how to live their values and understand the effects of doing so; and to identify ways to avoid humanity’s extinction. Simple curve-fits to world deaths from the pandemic suggested that, left unchecked, it could result in extinction by August of next year. I knew enough biology to dismiss that as highly unlikely, but it would almost certainly result in a population peak, and close to the time that my new simulation (Green’) was indicating.

  
ABOVE: Projections of population for simulation Green’ and with projected COVID-19 deaths (as of March 31, 2020). Unchecked deaths would result in extinction, a population of zero, by day 560 (August 3, 2021).

If the new population reached its peak on schedule around September 1, 2020, and then synchronized with the Green’ population projection, the net deaths would be the difference between the values of the two peaks. The virus would essentially wipe out the gain in population since mid-2019 that appears at the resolution of weeks instead of years.


ABOVE: Global variables projected for simulation Green’ at mid-year 2000-2050.

If the average population and per-capita consumption stay at the 2019 values from 2020-2021 (to crudely account for reduced activity as well as population), the model projects that extinction will occur one year earlier than otherwise, as shown below.


Looking ahead toward how to achieve the primary goal of avoiding extinction, the prescription remains the same as before: reduce per-capita consumption as soon as possible while maintaining constant population. A 2% annual reduction from 2021-2062 would keep the global temperature anomaly below the catastrophic level until 2100, as shown below.


Doubling the decrease in per-capita consumption until only basic needs are met, as shown below, adds another 50 years to the time when the maximum temperature is reached.


Note that these projections reflect my personal valuing of human life. Letting population decrease instead would keep per-capita consumption at an arbitrarily higher level, even though the economy would likely drop more (because it depends strongly on the number of transactions, which varies with the square of population).

Wednesday, February 5, 2020

Drop Ratios


After 2001, some people began experiencing falling happiness and life expectancy in my Timelines simulation (“Green”) that best matches our history. Starting in 2012, both of those variables were zero for a growing number of people whose part of the population was essentially living the rest of their lives without being replaced by children. The rest were still growing toward the peak that they had left. These conditions are identified in the following example as ranges of “action phases” that are derived from the ratio of unused resources to resources used to meet people’s basic needs.


ABOVE: Distributions of population, happiness, and life expectancy as functions of action phase at the beginning of 2020. Three ranges of phase identify trends in happiness and life expectancy: Growing (phases 1-5), Falling (phase 6), and Dying (phase 7). In this example, 16% of the population is growing, 35% (51% minus 16%) is falling, and 49% (100% minus 51%) is dying.

The conditions can be further reduced to “drop ratios” that compare the amount of people falling and dying to the amount of people growing. These are defined in the following graph, which projects how they change over time. Note that historical data is used for years through 2014 (where a “year” corresponds to the middle of the calendar year), and every year after that is a projection.


Drop Ratio 1 is the raw drop ratio, is now more than five, and is projected reach nearly eight before the total population is projected to peak and then decrease. It notably decreased just once, in 2009, corresponding to the global recession in that year, but has increased every year since then.

To the extent that people’s motivations might track with their membership in these phase ranges, it is conceivable that the people in the falling range might be split between siding with those who are growing and those who are dying. Drop Ratio 2 assumes an even split between the two.  

The following graph shows the drop ratios as functions of world phase (the phase for the world as a whole). Also shown is the fraction of the population that is falling and dying, which begins at phase 5. For reference, the world phase at the end of this month will be 5.8. 


Monday, February 3, 2020

Social Cohesiveness

The differences in experiences between people in a group can provide some insight into the cohesiveness of the group as a society, which recently has appeared to be decreasing. Action phases provide a measure of those differences, which correspond to different ranges of global variables that can be loosely associated with roles and experiences in the manipulation and distribution of resources throughout the population. The total range of phases has tended to expand throughout history, as shown below for the simulation “Green.” 


If the world of this simulation as a whole was experienced by a single person, that person would follow the World phase trajectory in the graphs. This is considerably different from the average person (the green line marking the 50% trajectory) and the person with the highest phase (the red line). Those people in the 10% with the lowest phases are the most different from the rest of the population, now occupying five of the seven phases where people can be found.

Global variables projected for the end of this month are shown below for the range of phases as it will exist then. The obvious phases people would want to occupy are 4 and 6 based on life expectancy and happiness, but the expansion of the range of phases caused by the reduction of unconsumed resources is forcing everyone higher - toward the dropping population that follows a maximum phase of 8 and a world phase of 6. The graph shows half the population above phase 7, with no happiness or life expectancy (for children born in that group), which will surely be a major event for the simulated world it inhabits.


To the extent that the simulation coincides with our real world on which it is historically based, the changes in life expectancy and population growth will be observable here on a global scale, although individual nations will vary based on their resources, consumption, and interactions with each other. 

With so much at stake, it would be unsurprising see social fragmentation of the population into three groups: the one-sixth of the population that benefits from increasing consumption; the half that is being driven toward death; and the remaining one-third that is suffering catastrophic loss of happiness and life expectancy. Such fragmentation would have a strong economic component, since the one-sixth that wants more consumption owns four-fifths of the world’s wealth, and that wealth tends to increase with consumption.


Monday, December 23, 2019

Termination


In early 2014, people in the simulated worlds I call "Green" and "Hikeyay" began entering the Termination phase, and external impacts started to drive available resources down. Green is what I consider the best match to our real world, and Hikeyay is the world portrayed in my fictional Simulated News blog. Termination is marked statistically by high age and no life expectancy, ending in the Death phase a few years later. 

By early 2020, half of Green's population will be in the Termination phase, and people will be in the Death phase by 2026. I chose a different path for Hikeyay by essentially reversing the drivers of extinction: stopping population growth; reducing per-capita consumption; and using technology to eliminate both waste and the external impacts. The timing of Hikeyay's global strategy (especially the new version that was recently "approved") is determined by the simulations, which are based on correlations between variables and trends identified in the historical record, and is consistent with recommendations from people who have studied the range of possibilities in far greater depth than I have.

I have been attempting to add higher resolution to the simulations that could ideally guide actions by groups and individuals to reduce the number of people in the Termination phase (from whatever that number might actually be). The results are being presented in all my venues – especially this blog, the Simulated News blog, Twitter posts, and Patreon posts. 

For example, since my last post here I have identified two major groups within the global population whose constant merging may help to explain political preferences within the actual population: one of them embodies the past and the other embodies the future; and their relative population sizes tantalizingly correspond in percentage to those of U.S. conservatives and liberals. I have also derived population-level phases and how many people might be supported in each nation if the world has a healthy overall phase distribution determined by total consumption. 

Just recently, I had an insight into the interactions between people in different phases that prompted a new way of visualizing their relative amounts of population and consumption. It is based on the trading of resources from high to low phases that best matches historical data, and accounts for the counterintuitive observation that those people who consume the most have the highest ratio of natural resources to resources used for basic needs (are at the lowest phase). Essentially: the majority in settled territory is converting raw resources to processed resources, and trading them with "colonizers" who are exploring and preparing new territory and its resources that are becoming so scarce that they will become processors right after people begin entering the Death phase at the population peak (five years from now in simulated world Green).


Friday, September 13, 2019

C-low

A new simulation ("C-low") using my updated Timelines model holds annual population change equal to the historical raw death rate while reducing per-capita consumption so that by 2040 no one is in the decline or termination phases as shown in the following graphs. As before, external ecological impacts such as climate change are taken into account along with our affect on them until that point, after which the impacts will need to have been stopped to avoid disaster.

By comparison, the "Hikeyay" simulation used for the Simulated News blog includes a population rate based on estimated population loss due to age that is more than four times the historical death rate to achieve a lower maximum phase (5.4 vs. 6.0). The best we can do to reduce total consumption, using the current death rate and a final per-capita consumption that allows for basic survival only (simulation "C-min"), results in a maximum phase that is just a little larger than Hikeyay (5.6).

The model's improved evaluation of economic variables, now including the observation that money flows from high phase to low phase – which the previous observation of flow from small to large per-capita consumption very closely approximates – confirms that wealth inequality is still a problem regardless of what approach we take. Our present inequality (the ratio of maximum to minimum wealth per person) is still the highest: about nine times C-low and Hikeyay in 2040; and about eight-thousand times C-min in 2040.

I am inclined to claim that I misjudged the fraction of the population dying due to age in the Hikeyay simulation, and favor the C-low simulation instead. In that case, per-capita consumption would need to decrease by 3.75% per year until external impacts stop (resources stop becoming unavailable for consumption). If impacts continue past 2040, restarting population growth will become progressively harder, and basic needs will not be supportable after 2050, virtually ensuring the extinction we are trying to avoid.


Friday, August 30, 2019

Redefining Waste

Further testing of my Timelines model has revealed that what I've been calling "waste" should be redefined. Instead of representing resources that are unusable, it represents resources we are using that should not be used. Specifically: whatever we consume that is more than half the world's total resources is waste, which I project is currently 20% of all that we consume and 12% of all resources. As a consequence, "wants" are that we consume that is more than our needs and does not include waste.

By this definition, waste first appeared in 2004 and is projected be greater than what we consume for needs in 2027, four years after global population reaches its maximum and begins declining. Since it is equivalent to other resources (instead of being un-consumable as with the previous definition), it is treated likewise by the world's population in every respect. The only un-consumable resources are those removed from the total by "self-sustained impacts" that are projected to have begun by 2015.

ABOVE: Projected fractions world ecological resources in the "Green" simulation using the new definition of waste.

Difficulty reproducing global wealth statistics was the initial clue that "uninhabited regions" (data points with no people or other species) were problematic. The estimate of relevant resources couldn't be justified with the more refined approach that now includes a better estimate of the numbers of people who have common characteristics related to other global variables with many more data points. 

Experimenting with different ways of allocating consumed resources over the world population including that "waste" resulted in two fundamental observations about both economics and consumption when the statistics were reproduced which are obvious in retrospect. First, the exchange of resources and money (that represents both resources and the value of exchange) predominantly flows from people who consume less to people who consume more. Second, the resources consumed for more than needs are distributed in proportion to the ratio of available resources to resources consumed for needs – the reciprocal of the people-to-nature ratio that I discovered is a basic driver of many of the variables I've been tracking.

Although the new definition of waste and allocation of consumption significantly change the projections of related global variables within the population, they have no effect on projections of the entire population over time and support general behaviors found with the earlier version. For example, consuming wants in addition to needs is still associated with a switch from an egalitarian to unequal distribution of wealth, but the details of that switch are different; and the upcoming changes more resemble a cascading failure than a "switch" to a new regime, driven as they are by the crashing of the world's population due to overconsumption (an aspect of which being increased waste).

ABOVE: Distributions of global variables associated with major changes in per-capita wealth projected by the "Green" simulation for dates shown below the Phase axis. Displayed are Phase = lifecycle phase, L = life expectancy, h = happiness, Fert = fertility, Cum P = cumulative population, R = total consumption, Cap = capacity, and C = per-capita consumption. The years projected for when part of the population begins to enter a new phase are shown as Epochs.


Thursday, August 22, 2019

A Brief History of Simulated Wealth

About sixteen hundred years ago, people on average began consuming more than what nature had allocated to meet their basic needs. At that point, personal wealth switched from depending on access to people to depending on access to resources. This enabled wealth to flow to fewer people who could trade and consume more resources. Extraction of resources increased environmental degradation which made fewer resources available for trade (the difference being "waste"). Perhaps as soon as 2025 there will be more waste than what people consume for basic needs, and more people will die than are being born. With fewer resources and fewer people, wealth will become more evenly distributed until everyone is dead. 

That scenario is based on a simulation of civilization, with a likely future where people do not work to reduce waste that is increasing faster than they are creating it (such as greenhouse gases that by amplifying climate extremes and chaos are making more of the world uninhabitable). In an alternative future projected by the fictional denizens of the simulated world "Hikeyay" featured in my Simulated News blog, total consumption is humanely forced down until 2040 so natural ecosystems can assist fighting climate change, resulting in wealth being cut to 1/6 of its starting value this year and wealth inequality dropping by more than half while waste is totally removed. Waste could come back with a vengeance if its external sources aren't disabled, but the means of stopping it cannot be done with wealth compensation if additional consumption is to be avoided.

The inherent dependency of wealth on per-capita consumption and transactions (proportional to the square of population) is also true of economic activity (embodied in gross domestic product) both as an observation and as a fundamental aspect of any economy. If everyone is consuming the same amount, such as meeting their basic needs, people's economic activity and wealth (the amount of resources being exclusively used) will vary with differences in population between groups. If people are consuming different amounts of resources (such as when consumption exceeds basic needs), then those who have the most resources (as wealth) will be at the focus of the most activity.

Performing functions such as removing waste would undoubtedly require some consumption of resources to create, deploy, and maintain any technologies involved. Offsetting existing consumption is one way to avoid this problem, which governments traditionally accomplish by collecting taxes and ensconcing wealth as capital "owned" by its citizens that cannot be traded by them. Other species (as our species once did) perform many such functions as part of meeting their basic needs, and as "resources" meeting the basic needs of others, therefore making that work and its results essentially free. Using other species in this way is ideal if we are to limit our consumption, while using institutions such as government is justifiable only until existing consumption can no longer be offset, such as when taxes keep citizens from meeting their basic needs. 

In the admittedly unlikely future of Hikeyay, people will work together to improve the scope and health of natural ecosystems while reducing their personal consumption and population to what can be maintained with the amount of available resources projected for 2040 by a coordinating institution that collects and processes observations from around the world. In the worst case, externally increasing waste is unstoppable and people end up barely meeting their basic needs until diminishing resources crash the population. In the best case, a stable population consumes the same amount per person as the world did around 1920. This is what I see as the best case for us too.


BELOW: L = life expectancy, h = happiness, Fert = fertility, Cum P = cumulative population, World P = world population, R = total consumption, Cap = capacity, C = per-capita consumption. Year of plot indicates associated phase with dark triangle below x-axis.