The term “values” can be reduced to what someone uses to define “good” and “bad.” In my attempts to quantify it and relate it to behavior and global outcomes, I’ve identified a set of resources and amounts of them that everyone has and uses to some extent. Fractions of the totals of each per person throughout a population, representing how much each resource is valued, are ranked based on calculated distributions of each using historical projections of the totals over time that are embodied in simulations.
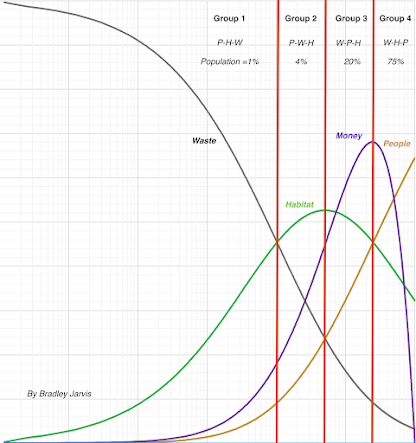
There are four identifiable groups that remain constant in their fractions of the population until too little habitat remains to support each person and members of the species that maintain it. The ranks of value placed on waste (artificial environments), habitat (natural environments), and people are unique to each group, as shown below. Note that the two middle groups could also be considered one group, as mentioned in Distributions.
Waste is valued most by the smallest group and people are valued most by the largest group. Habitat is valued most by the two middle groups, with one valuing waste second and the other valuing people second. No one in one group places the same amount of value on people or waste as anyone in another group. Members of either of the middle two groups can value habitat the same as members of the other group, but not members of either of the two remaining groups. Some members of the smallest and largest groups can value habitat the same, but no one can value habitat the same as members of the two middle groups.
If the value placed on each of the resources is exclusive of the others across the whole population, the fraction of the population valuing waste is 9%, the fraction valuing habitat is 40%, and fraction valuing people is 51%. Note that even for these groups, the fraction valuing people is much larger than the fraction valuing waste.
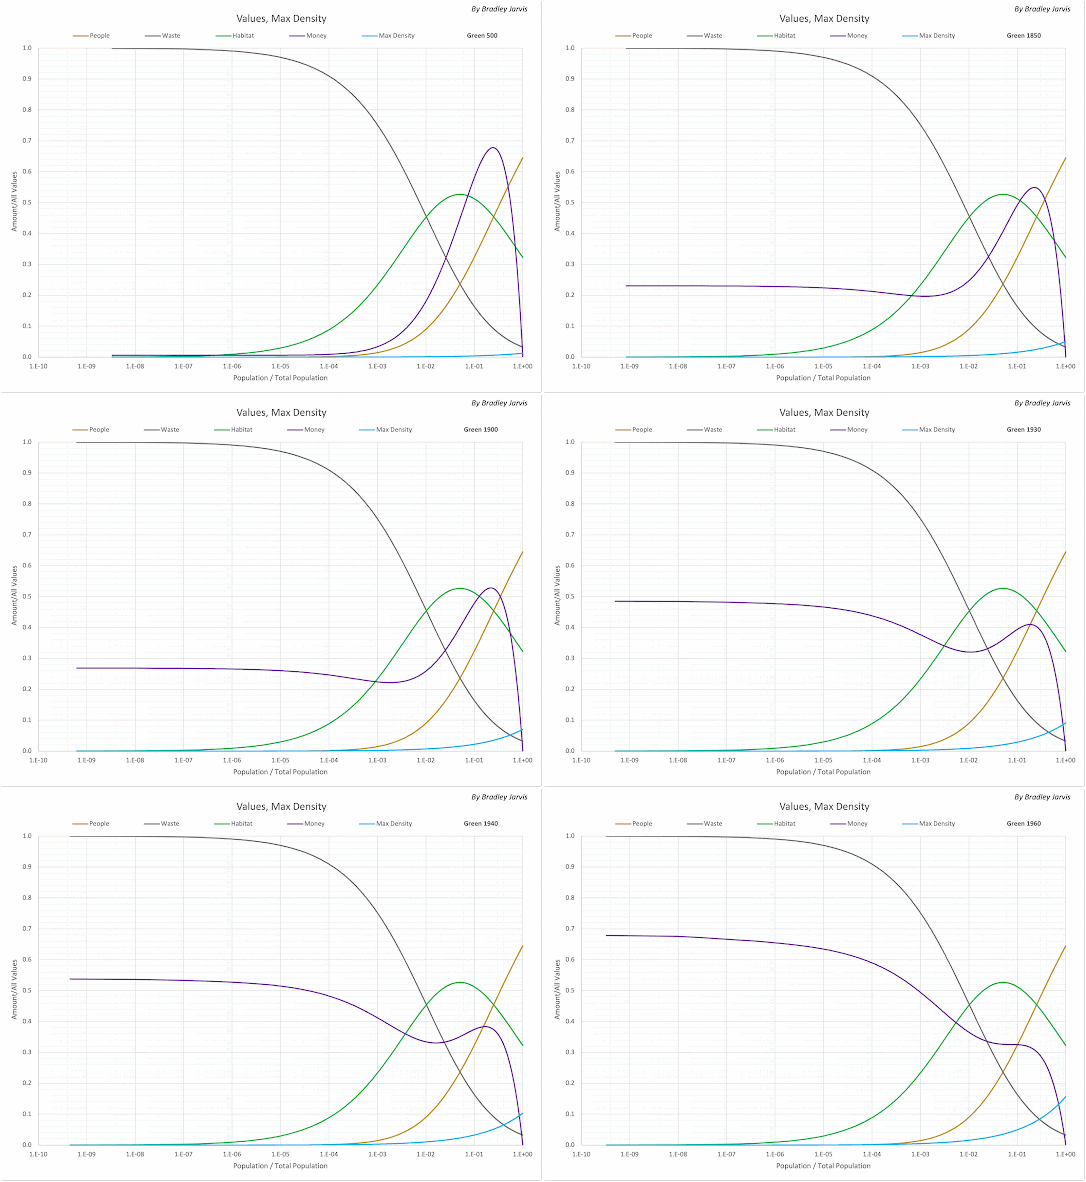
Money as a resource indicating relative economic activity (as indicated in the diagram for small populations and discussed in Economic Distribution) have favored equal value placed on people and habitat (corresponding to half the total habitat available to the population) while promoting increased waste by those who value it most. As shown in the following graph, waste production by a simulated world like ours has outstripped population growth (driving human transactions) as a component of economic activity and remains strongly associated with it. The “rich,” those benefiting most from that activity, and everyone else, represent another set of groups - defined by the value placed on money.
Implicit in this approach to quantifying what someone considers good and bad is the debatable assumption that their current conditions represent what they prefer, and that others they compare themselves to are likewise in preferred conditions. Even using change over time might not be a reliable indicator of preferences; the change could be so far beyond the person’s control and the destination is opposite to their preference. Referenced to groups, a person could move from one group to another due to the actions of others or environmental effects that force change in availability and consumption of resources. This appears to necessitate an additional variable for consideration: choice. Based on national statistics from 1800-2017, happiness varies as shown below, as does life expectancy, where the red lines mark the limits of each the four groups we started with; this suggests that members of a population will tend to prefer a higher value of waste.
As waste effectively decreases habitat, the ability of nature to provide basic biological needs decreases to a point where more people die than are born, beyond which the population crashes. Thus, increased waste decreases how long the population can exist (its longevity). Another set of groups could therefore consist of a group that cares about longevity being longer and the other that doesn’t. The group that cares about longevity would likely value habitat more than anything and waste less than people; the other group would consist of everyone else.


