Monday, November 9, 2020

Habitat Loss


As our species dominated and the world’s ecosystems, we made them part of our own habitat. The tools we used to do so were simultaneously used to create artificial environments that removed or spoiled resources that could be used to meet the basic biological needs of species we directly or indirectly depended upon for our survival, threatening to exterminate them and - in much the same way - us. This is a story told by statistical simulation of our history by my Timelines model and ecological observation of how extinctions occur.


According to my simulations, resources available for meeting human needs (what I’ve called “ecological resources”) are now only double the amount consumed for needs. This allows for consumption of only 15% more needs before population reaches a peak and then collapses. Most likely, collapse occurs because the populations of species (counted as resources) that supply the resources we directly consume themselves collapse. Our population peak is projected to occur no later than 2024, after which casualties are unavoidable.


ABOVE: Current summary of global variables and their projected trajectories. 


The COVID-19 virus is already exacting a toll on our population. It can be thought of as a consequence of habitat loss, because the other species in our habitat are likewise experiencing habitat loss, being forced to share more of their space with us and enabling those that prey on them to prey on us. Critically shrinking habitat is making this situation catastrophically worse even as our temporarily restrained consumption slows the rate of the shrinking. 


Meanwhile, climate change is becoming a self-sustained feedback of our pollution that is destroying habitat and creating conditions such as melting ice that will drive it further on its own. Our collectively growing obsession with reducing greenhouse gas emissions (climate-altering pollution) might slow the destruction, but more is necessary because we are too close to the critical point where species including ours might not avoid collapse in time to recover. 


As I’ve suggested before, the best option is to radically increase the total amount of habitat by reducing what we are currently consuming (in needs and waste). This will buy time for us and the other species we save to create barriers to further loss, including cleanup of waste such as that threatens to increase global warming. My simulations of such an approach provide insight into the attendant physical and social consequences that be used to craft a strategy for making them a reality and monitoring the results.


ABOVE: Summary of global variables after a reduction in consumption from 2021 to 2030. Reducing the amount of greenhouse of gases in the atmosphere to avoid more dangerous temperatures would need to occur soon. 

Monday, August 24, 2020

Marginal Hope


I watched the last two nights of the Democratic National Convention, during which my chronic trepidation was replaced with the alternating concern and hope that I last felt before the disastrous U.S. election of 2016. Now as then, there is a choice between bad and insufficiently good responses to the threat of global extinction that could occur within decades.  The main difference is that bad choices, here and in other influential countries such as Brazil with its critical rainforest, have drastically reduced the range and practicality of good responses that might be taken now. 


One of the foreseen drivers of our own population loss - disease - has ironically bought humanity perhaps a couple of more decades by slowing its destruction of ecosystems needed for survival. That time should be used to stop and then reverse the destruction by reversing the drivers of extinction: habitat loss, invasive species, pollution (especially climate changing carbon), overharvesting, and human population growth that multiplies the others. 


Much of the world's attention has been on fighting climate change while improving people's quality of life. This aim is behind the most conspicuous environmental plan advocated by the Democratic party's presidential nominee, which attempts to eliminate all carbon emissions by 2050 by developing new "green" technologies that a revitalized economy can deploy over the intervening period and maintain afterward. 


I have used my Timelines model of global variables over time to explore implications of this plan, and found that it would require a 97% decrease in total ecological footprint (what I've been calling consumption) from 2021 to 2050. With our present capabilities, the decrease would almost necessarily require a huge drop in population so that those alive in 2050 could at least meet their most basic needs with the resources they can use, and leave nearly two trillion tonnes of already emitted greenhouse gases in the atmosphere. 


What may be the most obvious alternative for those of us who reject mass casualties is to simultaneously reduce per-capita ecological impact, and to fully develop and deploy technology that can quickly convert previous emissions into forms that will not raise global temperatures or cause harm through other modes of extinction such as habitat loss and (different) pollution. Reducing the pollution load on natural carbon sinks such as soils and oceans would be a reasonable priority in this phase of the effort, which must be completed over the next decade (after which we won't all be able to meet needs).


My trepidation over the plan as presented by the only political party willing to admit and address the extinction threat is that it does not demonstrate an appreciation of the urgency, scale, focus and sacrifice that is required. It is, however, a vast improvement over existing alternatives which almost certainly will push us and the world further along our trajectory of doom.


Wednesday, April 15, 2020

A Pandemic-Altered Future


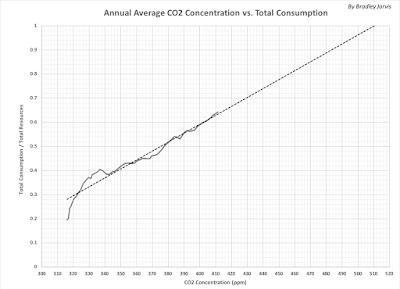
I have continued refining my simulations to account for the progress of the COVID-19 pandemic and the potential futures that might result from it. The strong correlation of carbon emissions and total consumption suggested that atmospheric carbon dioxide concentration could be used to estimate total consumption; I would then project total consumption along with the ratio of needs to remaining resources based on population projections made from pandemic global death statistics and my simulation (Green Prime) of population without the pandemic.

A curve fit of carbon dioxide concentration and total consumption automatically factored in the effects of natural contributors and the cumulative aspect of consumption and extracted the resulting consumption, as shown below.


I updated projections using weekly mean concentration and the average difference between Green Prime population and total deaths from COVID-19. The current projections are shown below.


Despite the apparent convergence of deaths toward a maximum beginning in May, the projected population (“R Projected”) suggested a much different situation. This was perhaps due to an excess of deaths by people who couldn’t be treated for life-threatening conditions other than the virus, or it was due to underlying growth in the virus-related deaths, or both, but it convinced me to continue allowing the possibility of greater growth in deaths as shown in today’s population projections below.


Projecting global variables into the future based on current data shows that the virus would result in one year less of survival for our species, as shown below.


Reducing per-capita consumption (ecological footprint) would still extend our remaining time, although temperature would continue to rise. The following graph shows one such scenario: a 2% annual drop until just needs are being met.

Another option is to freeze consumption at peak happiness and life expectancy as shown below. This would result in temperature exceeded the 2-degree Celsius threshold earlier, which would likely force a decrease in population.


Tuesday, March 31, 2020

Bridging the Future


Shortly after discovering that constant capacity (total ecological resources) provided a better fit to historical data by my Timelines model than my baseline simulation (“Green”) that decreased it, the COVID-19 pandemic threatened to significantly change the world’s population-consumption trajectory on its own. 

The model has two main purposes: to help people judge how to live their values and understand the effects of doing so; and to identify ways to avoid humanity’s extinction. Simple curve-fits to world deaths from the pandemic suggested that, left unchecked, it could result in extinction by August of next year. I knew enough biology to dismiss that as highly unlikely, but it would almost certainly result in a population peak, and close to the time that my new simulation (Green’) was indicating.

  
ABOVE: Projections of population for simulation Green’ and with projected COVID-19 deaths (as of March 31, 2020). Unchecked deaths would result in extinction, a population of zero, by day 560 (August 3, 2021).

If the new population reached its peak on schedule around September 1, 2020, and then synchronized with the Green’ population projection, the net deaths would be the difference between the values of the two peaks. The virus would essentially wipe out the gain in population since mid-2019 that appears at the resolution of weeks instead of years.


ABOVE: Global variables projected for simulation Green’ at mid-year 2000-2050.

If the average population and per-capita consumption stay at the 2019 values from 2020-2021 (to crudely account for reduced activity as well as population), the model projects that extinction will occur one year earlier than otherwise, as shown below.


Looking ahead toward how to achieve the primary goal of avoiding extinction, the prescription remains the same as before: reduce per-capita consumption as soon as possible while maintaining constant population. A 2% annual reduction from 2021-2062 would keep the global temperature anomaly below the catastrophic level until 2100, as shown below.


Doubling the decrease in per-capita consumption until only basic needs are met, as shown below, adds another 50 years to the time when the maximum temperature is reached.


Note that these projections reflect my personal valuing of human life. Letting population decrease instead would keep per-capita consumption at an arbitrarily higher level, even though the economy would likely drop more (because it depends strongly on the number of transactions, which varies with the square of population).

Wednesday, February 5, 2020

Drop Ratios


After 2001, some people began experiencing falling happiness and life expectancy in my Timelines simulation (“Green”) that best matches our history. Starting in 2012, both of those variables were zero for a growing number of people whose part of the population was essentially living the rest of their lives without being replaced by children. The rest were still growing toward the peak that they had left. These conditions are identified in the following example as ranges of “action phases” that are derived from the ratio of unused resources to resources used to meet people’s basic needs.


ABOVE: Distributions of population, happiness, and life expectancy as functions of action phase at the beginning of 2020. Three ranges of phase identify trends in happiness and life expectancy: Growing (phases 1-5), Falling (phase 6), and Dying (phase 7). In this example, 16% of the population is growing, 35% (51% minus 16%) is falling, and 49% (100% minus 51%) is dying.

The conditions can be further reduced to “drop ratios” that compare the amount of people falling and dying to the amount of people growing. These are defined in the following graph, which projects how they change over time. Note that historical data is used for years through 2014 (where a “year” corresponds to the middle of the calendar year), and every year after that is a projection.


Drop Ratio 1 is the raw drop ratio, is now more than five, and is projected reach nearly eight before the total population is projected to peak and then decrease. It notably decreased just once, in 2009, corresponding to the global recession in that year, but has increased every year since then.

To the extent that people’s motivations might track with their membership in these phase ranges, it is conceivable that the people in the falling range might be split between siding with those who are growing and those who are dying. Drop Ratio 2 assumes an even split between the two.  

The following graph shows the drop ratios as functions of world phase (the phase for the world as a whole). Also shown is the fraction of the population that is falling and dying, which begins at phase 5. For reference, the world phase at the end of this month will be 5.8. 


Monday, February 3, 2020

Social Cohesiveness

The differences in experiences between people in a group can provide some insight into the cohesiveness of the group as a society, which recently has appeared to be decreasing. Action phases provide a measure of those differences, which correspond to different ranges of global variables that can be loosely associated with roles and experiences in the manipulation and distribution of resources throughout the population. The total range of phases has tended to expand throughout history, as shown below for the simulation “Green.” 


If the world of this simulation as a whole was experienced by a single person, that person would follow the World phase trajectory in the graphs. This is considerably different from the average person (the green line marking the 50% trajectory) and the person with the highest phase (the red line). Those people in the 10% with the lowest phases are the most different from the rest of the population, now occupying five of the seven phases where people can be found.

Global variables projected for the end of this month are shown below for the range of phases as it will exist then. The obvious phases people would want to occupy are 4 and 6 based on life expectancy and happiness, but the expansion of the range of phases caused by the reduction of unconsumed resources is forcing everyone higher - toward the dropping population that follows a maximum phase of 8 and a world phase of 6. The graph shows half the population above phase 7, with no happiness or life expectancy (for children born in that group), which will surely be a major event for the simulated world it inhabits.


To the extent that the simulation coincides with our real world on which it is historically based, the changes in life expectancy and population growth will be observable here on a global scale, although individual nations will vary based on their resources, consumption, and interactions with each other. 

With so much at stake, it would be unsurprising see social fragmentation of the population into three groups: the one-sixth of the population that benefits from increasing consumption; the half that is being driven toward death; and the remaining one-third that is suffering catastrophic loss of happiness and life expectancy. Such fragmentation would have a strong economic component, since the one-sixth that wants more consumption owns four-fifths of the world’s wealth, and that wealth tends to increase with consumption.