Showing posts with label life expectancy. Show all posts

Saturday, August 26, 2023

Groups of Value

The term “values” can be reduced to what someone uses to define “good” and “bad.” In my attempts to quantify it and relate it to behavior and global outcomes, I’ve identified a set of resources and amounts of them that everyone has and uses to some extent. Fractions of the totals of each per person throughout a population, representing how much each resource is valued, are ranked based on calculated distributions of each using historical projections of the totals over time that are embodied in simulations.

There are four identifiable groups that remain constant in their fractions of the population until too little habitat remains to support each person and members of the species that maintain it. The ranks of value placed on waste (artificial environments), habitat (natural environments), and people are unique to each group, as shown below. Note that the two middle groups could also be considered one group, as mentioned in Distributions.
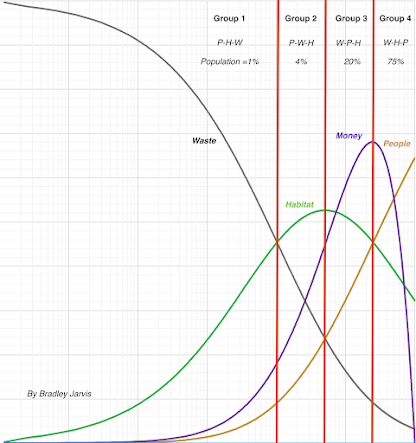
Waste is valued most by the smallest group and people are valued most by the largest group. Habitat is valued most by the two middle groups, with one valuing waste second and the other valuing people second. No one in one group places the same amount of value on people or waste as anyone in another group. Members of either of the middle two groups can value habitat the same as members of the other group, but not members of either of the two remaining groups. Some members of the smallest and largest groups can value habitat the same, but no one can value habitat the same as members of the two middle groups.

If the value placed on each of the resources is exclusive of the others across the whole population, the fraction of the population valuing waste is 9%, the fraction valuing habitat is 40%, and fraction valuing people is 51%. Note that even for these groups, the fraction valuing people is much larger than the fraction valuing waste.

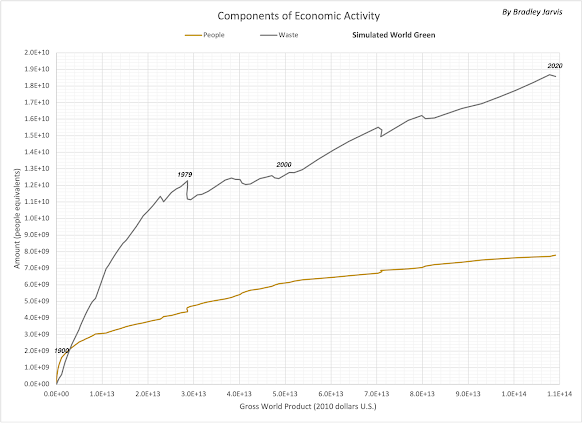
Money as a resource indicating relative economic activity (as indicated in the diagram for small populations and discussed in Economic Distribution) have favored equal value placed on people and habitat (corresponding to half the total habitat available to the population) while promoting increased waste by those who value it most. As shown in the following graph, waste production by a simulated world like ours has outstripped population growth (driving human transactions) as a component of economic activity and remains strongly associated with it. The “rich,” those benefiting most from that activity, and everyone else, represent another set of groups - defined by the value placed on money.
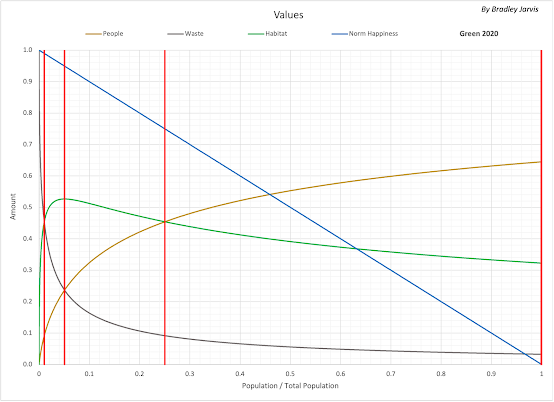
Implicit in this approach to quantifying what someone considers good and bad is the debatable assumption that their current conditions represent what they prefer, and that others they compare themselves to are likewise in preferred conditions. Even using change over time might not be a reliable indicator of preferences; the change could be so far beyond the person’s control and the destination is opposite to their preference. Referenced to groups, a person could move from one group to another due to the actions of others or environmental effects that force change in availability and consumption of resources. This appears to necessitate an additional variable for consideration: choice. Based on national statistics from 1800-2017, happiness varies as shown below, as does life expectancy, where the red lines mark the limits of each the four groups we started with; this suggests that members of a population will tend to prefer a higher value of waste.

As waste effectively decreases habitat, the ability of nature to provide basic biological needs decreases to a point where more people die than are born, beyond which the population crashes. Thus, increased waste decreases how long the population can exist (its longevity). Another set of groups could therefore consist of a group that cares about longevity being longer and the other that doesn’t. The group that cares about longevity would likely value habitat more than anything and waste less than people; the other group would consist of everyone else.


Wednesday, April 15, 2020

A Pandemic-Altered Future


I have continued refining my simulations to account for the progress of the COVID-19 pandemic and the potential futures that might result from it. The strong correlation of carbon emissions and total consumption suggested that atmospheric carbon dioxide concentration could be used to estimate total consumption; I would then project total consumption along with the ratio of needs to remaining resources based on population projections made from pandemic global death statistics and my simulation (Green Prime) of population without the pandemic.

A curve fit of carbon dioxide concentration and total consumption automatically factored in the effects of natural contributors and the cumulative aspect of consumption and extracted the resulting consumption, as shown below.


I updated projections using weekly mean concentration and the average difference between Green Prime population and total deaths from COVID-19. The current projections are shown below.


Despite the apparent convergence of deaths toward a maximum beginning in May, the projected population (“R Projected”) suggested a much different situation. This was perhaps due to an excess of deaths by people who couldn’t be treated for life-threatening conditions other than the virus, or it was due to underlying growth in the virus-related deaths, or both, but it convinced me to continue allowing the possibility of greater growth in deaths as shown in today’s population projections below.


Projecting global variables into the future based on current data shows that the virus would result in one year less of survival for our species, as shown below.


Reducing per-capita consumption (ecological footprint) would still extend our remaining time, although temperature would continue to rise. The following graph shows one such scenario: a 2% annual drop until just needs are being met.

Another option is to freeze consumption at peak happiness and life expectancy as shown below. This would result in temperature exceeded the 2-degree Celsius threshold earlier, which would likely force a decrease in population.


Wednesday, February 5, 2020

Drop Ratios


After 2001, some people began experiencing falling happiness and life expectancy in my Timelines simulation (“Green”) that best matches our history. Starting in 2012, both of those variables were zero for a growing number of people whose part of the population was essentially living the rest of their lives without being replaced by children. The rest were still growing toward the peak that they had left. These conditions are identified in the following example as ranges of “action phases” that are derived from the ratio of unused resources to resources used to meet people’s basic needs.


ABOVE: Distributions of population, happiness, and life expectancy as functions of action phase at the beginning of 2020. Three ranges of phase identify trends in happiness and life expectancy: Growing (phases 1-5), Falling (phase 6), and Dying (phase 7). In this example, 16% of the population is growing, 35% (51% minus 16%) is falling, and 49% (100% minus 51%) is dying.

The conditions can be further reduced to “drop ratios” that compare the amount of people falling and dying to the amount of people growing. These are defined in the following graph, which projects how they change over time. Note that historical data is used for years through 2014 (where a “year” corresponds to the middle of the calendar year), and every year after that is a projection.


Drop Ratio 1 is the raw drop ratio, is now more than five, and is projected reach nearly eight before the total population is projected to peak and then decrease. It notably decreased just once, in 2009, corresponding to the global recession in that year, but has increased every year since then.

To the extent that people’s motivations might track with their membership in these phase ranges, it is conceivable that the people in the falling range might be split between siding with those who are growing and those who are dying. Drop Ratio 2 assumes an even split between the two.  

The following graph shows the drop ratios as functions of world phase (the phase for the world as a whole). Also shown is the fraction of the population that is falling and dying, which begins at phase 5. For reference, the world phase at the end of this month will be 5.8. 


Monday, February 3, 2020

Social Cohesiveness

The differences in experiences between people in a group can provide some insight into the cohesiveness of the group as a society, which recently has appeared to be decreasing. Action phases provide a measure of those differences, which correspond to different ranges of global variables that can be loosely associated with roles and experiences in the manipulation and distribution of resources throughout the population. The total range of phases has tended to expand throughout history, as shown below for the simulation “Green.” 


If the world of this simulation as a whole was experienced by a single person, that person would follow the World phase trajectory in the graphs. This is considerably different from the average person (the green line marking the 50% trajectory) and the person with the highest phase (the red line). Those people in the 10% with the lowest phases are the most different from the rest of the population, now occupying five of the seven phases where people can be found.

Global variables projected for the end of this month are shown below for the range of phases as it will exist then. The obvious phases people would want to occupy are 4 and 6 based on life expectancy and happiness, but the expansion of the range of phases caused by the reduction of unconsumed resources is forcing everyone higher - toward the dropping population that follows a maximum phase of 8 and a world phase of 6. The graph shows half the population above phase 7, with no happiness or life expectancy (for children born in that group), which will surely be a major event for the simulated world it inhabits.


To the extent that the simulation coincides with our real world on which it is historically based, the changes in life expectancy and population growth will be observable here on a global scale, although individual nations will vary based on their resources, consumption, and interactions with each other. 

With so much at stake, it would be unsurprising see social fragmentation of the population into three groups: the one-sixth of the population that benefits from increasing consumption; the half that is being driven toward death; and the remaining one-third that is suffering catastrophic loss of happiness and life expectancy. Such fragmentation would have a strong economic component, since the one-sixth that wants more consumption owns four-fifths of the world’s wealth, and that wealth tends to increase with consumption.


Tuesday, July 10, 2018

Values Realized


What we want out of life comes at the expense of Nature. This fact drives our relationships with each other and the other species we share the planet with, as well as how long and how many of us can survive.

No matter what group or groups we might be part of, we are all part of one group: the human species. The number of people in that largest group, its population, has been growing since the beginning of civilization, reflecting the value we collectively place on people. Like other animals, each of us requires a minimum amount of resources to survive, so the amount of resources we consume increases with how many of us there are. Since the populations of other species use or embody much of those same resources, the resources must be shared over time for the system of life to last as long as possible.

Most of us would prefer to live long and healthy lives. Because sharing resources is so critical, and we embody resources that other species can use for food, extending our lifetimes reduces the amount of resources available to other life during the time they are needed by those other species. Thanks in large part to our ability to develop and share knowledge and skills, and translate those things into material objects that can accelerate the process, we have enabled more people to live past birth and to thwart more of other species' attempts to consume us. As a result, we have increased consumption and more than tripled the average amount of time people can expect to live from birth (life expectancy) since the beginning of civilization.

We would all like to have satisfying lives. Happiness means different things to different people, but statistically it tends to increase with consumption in much the same way as life expectancy. This can be interpreted to mean that it is an expression of how well people are able to match their lifestyles to their personal preferences, which is enabled by economies that distribute resources among people through trade. Economic activity, which is easier to measure than happiness and tied more directly to consumption, is therefore often used as a proxy for happiness.

The Timelines model projects that, if we live like people in the simulated scenario Timeline 2, then global population, life expectancy, and happiness will reach their maximum average values between 2020 and 2022. The good news is that most people will get to see the pinnacle of human achievement, even though it won't feel good for half of them. The bad news is that life expectancy and happiness will reach zero for everyone between 2029 and 2030, and no one will be left alive by 2038.

Since Timeline 2 has 82% of its recent history in common with ours, it makes sense to use it as a baseline for discussion of the future. The values of population, life expectancy, and happiness are all dependent on what fraction of remaining resources people minimally consume: as the fraction grows, the values grow until the fraction reaches about 57%, falling to zero for fractions larger than that. 

If we don't want the values to drop (especially for population), then it makes sense to keep the population below its peak (affecting minimal consumption) and our additional consumption from growing (affecting the remaining resources). This is the logic behind the Fix timeline. We could alternatively let events unfold without intervention and hope that people will not overshoot the peaks; but if they do, that the apparent desire to consume more will be overcome by a desire to seek out the peaks, and they will voluntarily reduce their consumption to reach the peaks again.

The Fix and the "wait-and-seek" strategies include an implicit assumption that depletion of remaining resources is totally within people's control. The depletion beyond the economic equivalent of renewable products and services provided by other species is largely due to harm and killing of the species that provide them, and harm to species that those species depend on for survival. Those effects are caused by the same drivers as extinction: habitat loss, alteration of ecosystems by invasive species, pollution, use of common resources by the human population, and direct killing due to hunting and over-harvesting. Pollution in particular is having a greater role by changing the climate, whose predictability all species (including us) depend on for a variety of deep biological reasons, not the least of which being growth of plant life needed for food and oxygen production. When changes people make to the environment lead to cascades of changes that are self-reinforcing (positive feedback), then depletion multiplies beyond control.

In Timeline 2, the "waste" component of consumption (consumption in addition to basic needs and wants) accelerates its increase while population drops after the population peak. This may indicate that during that period it will be self-sustaining. If so, perhaps the significance of the population peak – and maybe the others – is that humans in Timeline 2 have a biological self-destruct trigger that activates when their actions initiate uncontrolled collapse of the biosphere they depend on for survival. The Fix timeline would therefore be impossible without some extremely powerful, and as-yet nonexistent, technology that could repair the damage as it occurs.

Another timeline diverged from ours and Timeline 2 in 1939. World War II was averted there, resulting in slower development of technology and science. The same desires and constraints existed, however, and the population peak was only delayed another 60 years...


Thursday, July 2, 2015

Units of Completion

Further investigation of the application of task completion time to the global variables defining humanity's past and future has yielded another surprising insight. People over time have apparently collaborated over time in a series of tasks focused on increasing life expectancy to successively higher values.

With an average efficiency of 50%, and knowing the maximum we could achieve, we would expect to halve the difference between our current value and that maximum during each of several attempts (assuming the success we achieved during each attempt was preserved). Each attempt would take the same amount of time as the best-case (going from zero to the maximum with 100% efficiency).

This isn't what happened. It took millions of years to complete the first pass, which we seem to have treated as a single task on its own, achieving a life expectancy of 35 years in 1900. The second pass also proceeded as a separate task aimed at 53 years, which we completed in just 61 years. There were six more such tasks after that, each taking significantly less time than the task before it, and we reached what my Half-Earth Hypothesis projects as the maximum (71 years) in 2011.

For at least two years after that, life expectancy decreased. Though the projection indicates that the decrease is temporary, it also shows that it is an artifact of our being at the peak, and a more pronounced and sustained decrease is imminent if we continue to increase our consumption of ecological resources.

My analysis also yielded another interesting insight, which relates to earlier study of complexity. Although I stand by my observation that performance of a single, continuous task is unlikely to reliably and measurably exceed 95% completion because of the influence of unknown and uncontrollable variables (otherwise known as "luck"), there is a granularity of real tasks that can be used to define a target value that incorporates what I think of as "resolution," or "acceptable error."

If we think of a task as the effectively-simultaneous manipulation or creation of a number of observable units, equivalent to what I've described as "interactions" in the description of an event, our uncertainty in assessing completion of the task will have a maximum value equal to one unit, which, as a fraction of the total, is the reciprocal of the number of units. The amount of completion we can verify, therefore, is one minus this fraction. For example, if a task consists of writing a 500-word page, and the result is defined by the number of words, then the maximum meaningful completion is 0.998, or 99.8%, which we can then use to calculate the expected time in terms of the best-case completion time. Luckily for those of us who like doing calculations in our heads, the completion time for the average person (at 50% efficiency) equals the number of times we must multiply 2 by itself to get the number of units; so for the example of 500 words, we know that the completion time is about 9. For 95% completion, the number of units is 20, which corresponds to a completion time close to 4.

What really got me excited about this was the discovery of new significance for two of the critical numbers coming out of the Half-Earth Hypothesis. Recall that the maximum amount of ecological resources we can consume is limited by the need to conserve the living and non-living providers of the basic resources we need to survive, which means we must leave alone the equivalent of half the renewable resources provided by Earth's biosphere (thus the source of the name "Half-Earth"). The sum of what we would be consuming at that point, plus the species providing our basic sustenance, can be no more than 82% of the total, and those species need an additional 15% of the total to meet their needs for survival. It turns out that, regardless of efficiency, 82% completion requires half as much time as 97% (82% plus 15%); and 97% as a maximum value corresponds to 31 units, which is easily remembered as the largest number of days in a month as well as around the smallest valid sample size for statistical analysis. Of course, 97% is also close to the 95% that I've observed as maximum reliable completion.

I am keenly aware, and must remind readers, that these discoveries and the reasoning behind them are best considered as hypotheses that remain to be extensively tested. They represent informed opinions and interesting patterns in data that may be either misleading or groundbreaking. At the very least, I find them extremely interesting, and worthy of further study and discussion to help bring into new context the facts we know and might find later.


Thursday, February 24, 2011

Prime Happiness

Key events in the history and potential future of the world's population seem to be associated with prime number multiples of minimum happiness (life satisfaction). This may be a coincidence, or it may be an indicator of some deep biological connection with Nature's limits. Whichever is the case, it's extremely fascinating.

First, some background: Happiness, as a fraction between zero and 100%, appears to be related to how many natural resources we each consume per year. By estimating this per-capita consumption for the world's population, we can calculate what the happiness is. I have a mathematical model that does this, along with estimating the size of the population, how many resources there are, and how fast we must be able to move what we consume (transport speed). The model and its results are detailed both in this blog and on my Web site.

I became interested in happiness in an attempt to explain how population and per-capita consumption appear to be in synch with each other, and have been recently focusing how fast population and resources change. The clearest connection with happiness comes from how fast these growth rates themselves change, similar to the familiar concept of acceleration (the speed of something's speed). A pattern emerged when I compared these accelerations to multiples of minimum happiness for the past and for potential futures.

Minimum happiness is simply how happy people are when consuming the least amount of resources, which I expect to be equivalent to today's poorest people. Everyone was at this minimum more than two-thousand years ago, and the world had a stable amount of resources that humanity could eventually use. As the population grew, there was enough labor to extract more resources, which enabled further growth. Because total consumption – how much everyone was consuming – is proportional to the square of population, the total amount of resources decreased more and more rapidly (it accelerated).

By the time 10% of the initial resources had been consumed, in the late 1800s, happiness had doubled (the multiple of happiness was two). This also translated into an increase in life expectancy of nearly half. The speed of the population rate (the acceleration of population size) stopped increasing and began decreasing.

In 2008, we passed the tripling of happiness (a multiple of three). The population has already stopped accelerating, corresponding to a peak in the population rate, and the population rate is now decreasing toward what I project will be an eventual crash as it continues to fall past zero. At that zero point, when the population is as high as it will ever go, resources will once again be at a 10% point, but this time only 10% of the initial amount will remain, and happiness will be at a peak of 3.1 times the minimum. Life expectancy will be close to doubling (reaching a maximum of about 1.9 times its maximum), but never get there.

The only way to keep happiness increasing (but not the only way to avoid the crash) is to increase the number of resources. If we could do that, probably by settling much of the Solar System, we might be able to achieve 100% happiness for everyone, which would be nearly five times the minimum (actually, 4.9). It is odd and possibly significant that life expectancy would be a multiple of 2.7 times its minimum, very close to the value of one of the most important constants in mathematics: the base of natural logarithms.

There may very possibly be a biological limit associated with 100% happiness; but assuming there isn't, there is an ultimate limit to how much mass we can consume, set by transportation speed: the speed of light. Here is where we meet our last prime number. At the speed of light, happiness would be about seven times the minimum (actually, 7.3; the multiple of 7 would correspond to 0.4 times the speed of light). Life expectancy, meanwhile, would reach its highest level at 3.8 times its minimum.

I find it interesting that life expectancy shows an equally memorable pattern by nearly doubling when Earth's resources are exhausted, nearly tripling when 100% happiness is achieved, and nearly quadrupling at the ultimate limit. Perhaps the most amazing aspect of this analysis is the existence of both patterns existing simultaneously. Whether it's coincidence, an artifact of my math, or the discovery of a fundamental aspect of our relationship with the Universe, finding it has been both a lot of fun and confirmation that asking questions and exploring the implications of their answers is well worth the effort.