Saturday, August 26, 2023

Groups of Value

The term “values” can be reduced to what someone uses to define “good” and “bad.” In my attempts to quantify it and relate it to behavior and global outcomes, I’ve identified a set of resources and amounts of them that everyone has and uses to some extent. Fractions of the totals of each per person throughout a population, representing how much each resource is valued, are ranked based on calculated distributions of each using historical projections of the totals over time that are embodied in simulations.

There are four identifiable groups that remain constant in their fractions of the population until too little habitat remains to support each person and members of the species that maintain it. The ranks of value placed on waste (artificial environments), habitat (natural environments), and people are unique to each group, as shown below. Note that the two middle groups could also be considered one group, as mentioned in Distributions.

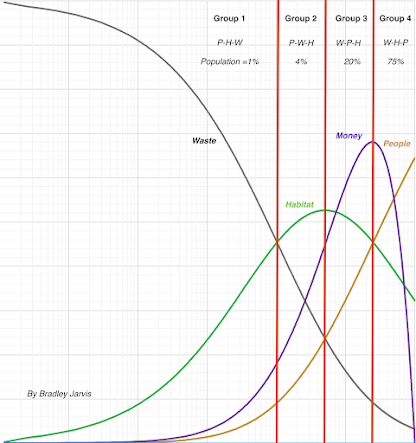
Waste is valued most by the smallest group and people are valued most by the largest group. Habitat is valued most by the two middle groups, with one valuing waste second and the other valuing people second. No one in one group places the same amount of value on people or waste as anyone in another group. Members of either of the middle two groups can value habitat the same as members of the other group, but not members of either of the two remaining groups. Some members of the smallest and largest groups can value habitat the same, but no one can value habitat the same as members of the two middle groups.

If the value placed on each of the resources is exclusive of the others across the whole population, the fraction of the population valuing waste is 9%, the fraction valuing habitat is 40%, and fraction valuing people is 51%. Note that even for these groups, the fraction valuing people is much larger than the fraction valuing waste.

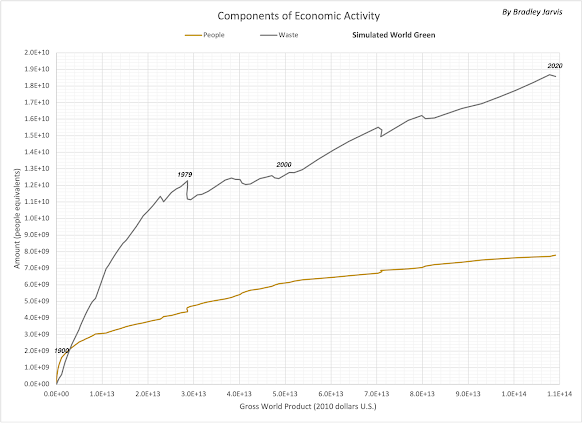
Money as a resource indicating relative economic activity (as indicated in the diagram for small populations and discussed in Economic Distribution) have favored equal value placed on people and habitat (corresponding to half the total habitat available to the population) while promoting increased waste by those who value it most. As shown in the following graph, waste production by a simulated world like ours has outstripped population growth (driving human transactions) as a component of economic activity and remains strongly associated with it. The “rich,” those benefiting most from that activity, and everyone else, represent another set of groups - defined by the value placed on money.

Implicit in this approach to quantifying what someone considers good and bad is the debatable assumption that their current conditions represent what they prefer, and that others they compare themselves to are likewise in preferred conditions. Even using change over time might not be a reliable indicator of preferences; the change could be so far beyond the person’s control and the destination is opposite to their preference. Referenced to groups, a person could move from one group to another due to the actions of others or environmental effects that force change in availability and consumption of resources. This appears to necessitate an additional variable for consideration: choice. Based on national statistics from 1800-2017, happiness varies as shown below, as does life expectancy, where the red lines mark the limits of each the four groups we started with; this suggests that members of a population will tend to prefer a higher value of waste.


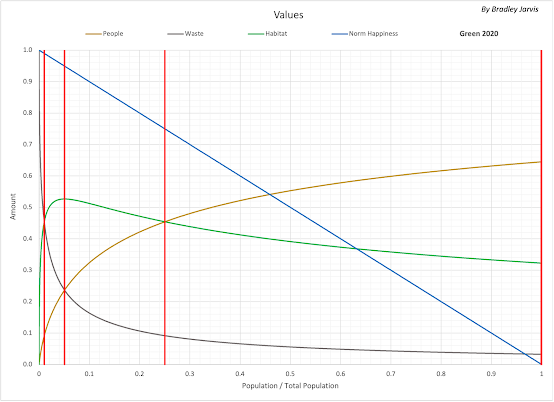
As waste effectively decreases habitat, the ability of nature to provide basic biological needs decreases to a point where more people die than are born, beyond which the population crashes. Thus, increased waste decreases how long the population can exist (its longevity). Another set of groups could therefore consist of a group that cares about longevity being longer and the other that doesn’t. The group that cares about longevity would likely value habitat more than anything and waste less than people; the other group would consist of everyone else.


Saturday, August 12, 2023

Economic Distribution

 Distributions of people, waste, and habitat throughout a population are, in part, maintained by economic activity that is reflected by the money people exchange with each other. Like those resources, that money can be treated as a resource and translated into a value relative to the others.

Because it depends upon total quantities of people and waste, exchanged money varies as those quantities change over time. Measured as Gross World Product (GWP), the total has generally increased. How much it is valued throughout the population is determined by the distributions of people and waste.

In simulated world “Green,” whose history is a close match ours, economic activity until the 1920s was most valued by those who valued both people and waste equally while placing the highest value on habitat. As more waste has been created by economic activity, a small fraction of the population, who values waste more than anything, has increasingly valued money that represents that creation. By the 1950s, the value of money to that group had risen to exceed the maximum value that any other group placed on people.

The focus of economic activity on the growth of waste has continued to the present. For most of Green’s history, 2% of the population has been responsible for 80% of the world’s waste. In 1960, that group was also responsible for 54% of the GWP. By 2020, it was responsible for 68% of the GWP. Increasing waste is largely responsible for decreasing habitat, which includes other species that maintain the habitability of any world; and starting this year, a growing number of people are projected to consume all the habitat available for their survival (a “density” of 1), altering every distribution. Waste, habitat, and people will approach equal value as the death rate increases, and money will be valued more than anything right before all are dead, which is projected to be in 2041.


Saturday, July 15, 2023

Distributions

People are organized into communities that enable the acquisition, movement, manipulation, and use of resources in order to maximize the quantity and quality of what they value. Each community has its own strategy for doing so based on its values, its abilities and the composition of its environment. 

Averaged over the world population for more than 70 years, my simulations show that the annual distributions among people of biologically useful resources have maintained a common pattern, with communities changing what parts of the pattern they occupy and the parts they interact with. The primary distributions are people, habitat (resources composed of, and used by, other species), and waste (resources converted by humans into forms that are not biologically useful). 

Processed to display how their amounts change relative each other, the distributions can be used to indicate how much different parts of the world’s population value people, natural environments (habitat), and created environments (waste). As the number of people is added up in order of increasing habitat density (people per unit of habitat), the value of people rises; the value of created environments drops; and the value of natural environments climbs to a peak and then falls. This is shown below.


There are three distinct groups defined by the intersections of the trends. The smallest, amounting to 1% of the population, is dominated by the value of waste over habitat and people. The second, amounting to 24%, is dominated by the value of habitat over the rest. The third and largest group, 75% of the population, is dominated by the value of people. Based upon my simulations, any isolated population with limited resources (embodied by habitat), that is not consuming more than a critical amount of them, will have these characteristics. 

Consuming more than two-thirds (67%) of total resources results in the first group growing at the expense of the other two until the amount of remaining resources is less than the total number of people - who will be in just one group that values everything equally. My simulation that best matches history shows that this year humanity will be consuming more than the critical amount, as shown below, and will reach the end point bordering on extinction by 2040.


Saturday, April 22, 2023

Thresholds


In my latest simulation of a world most like ours, which I call “Green,” the human population peaks in 2025 and crashes to zero by 2041. This year the systems that maintain remaining habitat begin to degrade significantly and inexorably, with the effect of waste pumped into the system of life that is in addition to the immense amount that humanity is annually creating. The trigger for the degradation is the elimination of a critical amount of the life that supports those systems.

As I write, those who care about other life and stopping our own global drive toward extinction are cele-brating Earth Day, calculated to be the day that humans are consuming all of the renewable resources that Earth’s ecosystems can furnish annually. Beyond that, we are in overshoot, consuming the producers of those resources in addition to what they produce. 

Inhabitants of simulated planet Green would have marked crossing that threshold three weeks ago, noting that annually a full two-thirds of the world’s total resources are being consumed. The citizens of their United States will be feeling several impacts of that excess consumption, among them passing maximum population in 2017 and peak per capita GDP last year. By the end of the decade, the nation will be func-tionally extinct.

Avoiding extinction for as long as possible is the goal of simulated world Hikeyay, named after a fictional community on a mountain in Colorado that nurtured a key character in my fictional blog SimulatedNews. As part of my effort to understand and help solve the extinction crisis, Hikeyay is a both a simulation and a mind experiment to explore what a solution might look and feel like. That solution involves decreasing total consumption starting in 2019, enabling the amount of healthy habitat to grow in the process. The good news is that extinction is delayed; the bad news is that global average temperature continues to climb.

Monday, January 30, 2023

Lay of The Landscape


For many years I had a bad sense of direction when thinking about how to get from one place to another. One way I learned to cope with that condition was to embrace getting lost as a learning experience and develop a “feel” for the organization of the places around me. By focusing on exploration instead of going somewhere, I became aware of the many ways that places are connected as a landscape instead of as a network of paths.

When someone would tell me how to go someplace, or how to achieve a particular objective, I would use their procedure to imagine a landscape being revealed. What my guide considered useful features along a chosen path, I found to be slivers of visibility into a system-as-landscape that the path and its endpoints were likely just a minor part of. 

If I was responsible for achieving a particular objective, and therefore forced to limit my exploration, I would focus on how being at that end would look and feel, discovering what variables most clearly de-fined it in a way that could be experienced through translation into ideas that made intuitive as well as abstract sense. In many cases, “navigation” involved changing the configuration of a system either directly or by integrating myself into it, where the feeling was largely one of artistically sculpting experience until it matched my definition of the system’s end state.

Often in my careers as a test engineer and technical writer, I was tasked with helping others achieve a given objective; and my exploration expanded to include the people I was helping, as part of the inhabited space. Understanding it as the flip side of being helped, where I had to translate what others shared with me, either by communication or shared experience, I included helping their translation as part of my personal interpretation of the task (a service I greatly appreciated when people would do the same for me). 

I became more conscious of these facts as a consequence of trying to distill a lifetime of experience into a framework for dealing with multiple existential crises that threaten both personal and societal longevity. My personal longevity crisis is simply one of age: biological breakdown is inevitable and imminent for someone this close to his life expectancy. Society, which I think of as the whole of organized humanity, is facing a limit to lifetime that is more self-imposed than inherently inevitable. If the whole of experience is a landscape, the part we share, as well as our own lives, has a rapidly approaching edge. Death defines the space beyond the edge, a world without us.

Taken as merely a region in a vastly larger landscape, our experience may be unique, but it is hardly special in any universal sense. As co-creators of our experience with its many components, we arbitrarily assign value to both it and parts of it, with differences in value a function of how we choose to define it. Large differences in value create contrast in our minds, which we associate with degrees of “specialness” of the underlying experience. Since value is purely arbitrary and we can’t physically access the full range of experiences it would take to define a common standard, we can either acknowledge or deny the limitations of our experience and perception of it. 

At some deep level, I think I have always distrusted people who act certain that where they want to go is the right way to go. That attitude suggests a belief that their experience and their judgment are innately more valuable than the experience and judgment of others. Alternatively, I have no problem with someone who has learned enough to make more useful guesses about how to get somewhere as long as they are honest about what they don’t know and can’t do; and are willing to learn and adapt, encouraging the same for those they might lead. People I trust the most, and who I’ve chosen to emulate, are willing to challenge what they know and what they value, learning and testing both of these by getting more experience and engaging in respectful collaboration with other people. In short, I tend to distrust those who deny limitations and trust those who acknowledge them; but overall, in the spirit of acknowledging limitations, trust is always provisional - especially trust in myself – which might ultimately be the reason I got lost so easily.

Self-confidence is, literally, trust in yourself. With it comes a sense of power and focus that encourages action. The opposite is what I feel as fear and disorientation that elicits indecision to the point of paralysis. An early lesson I learned from my father and later proved for myself through living was that trust must be earned and its basis always tested through observation. This lesson demands a range of caution that accompanies every action and is proportional to uncertainty that never falls to zero (which an honest person knows is impossible) and has an upper limit that enables learning through experience. 

Discomfort is always present but doesn’t have to be intolerable. I discovered what can best be described as fun fatalism: playfully creating new experience that reflects my chosen values that will be frozen in space and time beyond the boundaries of my life wherever and whenever those boundaries might be. The discomfort of provisional trust in myself thus became comparable to the aching of muscles that are stretched will per-forming one’s favorite sport, which in my case is exploring the lay of the landscape of my limited existence.

Note: This post was updated on 2/4/2023 with the image above. It depicts relationships of variables in my Timelines model: population (yellow), remaining nature (green), and happiness (red), as functions of habitat density (horizontal, left to right) and waste per person (depth, close to far).